Athletic scheduling is quietly draining time and budget across your district.
Manual scheduling creates hidden costs that compound every season:
- Staff hours cleaning spreadsheets
- Emergency fixes
- Transportation rework
- Overtime coordination
- Parent escalations
- Event cancellations
These costs rarely appear in budget line items, but they consume resources that could serve students directly.
Modern scheduling automation reduces operational friction by eliminating the highest-cost parts of manual scheduling.
Where Most Districts Lose Money
Manual Data Cleanup
Cost driver: 10–20 hours per season per school on spreadsheet reconciliation.
Districts with 8 schools: 80–160 hours of administrative time per season just cleaning data before scheduling can begin.
At a fully-burdened cost of $45/hour for administrative staff, that’s $3,600–$7,200 per season spent on data cleanup alone.
Schedule Corrections
Cost driver: Late changes create cascading rework across departments.
Each schedule change after publication requires:
- Transportation route updates
- Official reassignments
- Facility coordination
- Parent communication
- Website updates
A district experiencing 15 post-publication schedule changes per season at 2 hours per change: 30 hours of corrective work costing $1,350 in staff time.
Conflict Resolution
Cost driver: Administrative time spent fixing problems instead of preventing them.
Emergency conflicts require:
- Athletic director intervention
- Principal escalation
- Coach coordination calls
- Family notifications
- Makeup scheduling
Districts spending 40 hours per season on conflict resolution: $1,800 in reactive firefighting that generates zero educational value.
Transportation Inefficiency
Cost driver: Suboptimal schedules increase route complexity and driver overtime.
Poor travel optimization results in:
- Longer routes (higher fuel costs)
- Additional vehicles required
- Driver overtime for late returns
- Missed opportunities for route consolidation
A district saving 5% on athletic transportation through better scheduling: $8,000–$15,000 annual savings depending on program size.
Total Hidden Cost of Manual Scheduling
For a typical 8-school district running 4 major sports seasons:
| Cost Category | Annual Cost |
|---|---|
| Data cleanup | $14,400–$28,800 |
| Schedule corrections | $5,400 |
| Conflict resolution | $7,200 |
| Transportation inefficiency | $8,000–$15,000 |
| Total Hidden Costs | $35,000–$56,400 |
This excludes intangible costs: staff burnout, community complaints, reputational damage, and opportunity cost of time not spent on student-facing work.
How Modern Scheduling Delivers Financial Leverage
1. Cuts Manual Labor
Automation eliminates the highest-cost, lowest-value work:
Data cleanup – AI-assisted extraction handles spreadsheet imports, PDF parsing, and duplicate detection automatically. Reduces 20 hours of manual work to 2 hours of validation.
Deduplication – Automated matching identifies and merges duplicate schools, teams, and venues. Prevents data quality issues from cascading into scheduling errors.
Conflict detection – Real-time validation flags double bookings, travel violations, and fairness issues before schedules are finalized. Eliminates post-publication emergency fixes.
2. Reduces Downstream Corrections
Fixing errors before calendars are published prevents expensive rework:
Proactive conflict resolution – Issues flagged during planning phase, not after parent notifications sent.
Transportation optimization – Travel constraints enforced during schedule generation, not discovered during route planning.
Fairness validation – Home/away balance and competitive equity verified before publication, preventing complaints requiring schedule changes.
3. Prevents Operational Rework
Stable schedules reduce cross-department coordination costs:
Transportation – Fewer route changes mean consistent driver assignments and vehicle utilization.
Staffing – Predictable schedules enable efficient official assignments and facility supervision.
Facilities – Accurate schedules prevent double bookings requiring emergency venue changes.
Communications – Reduced change volume lowers parent notification workload and complaint management time.
Typical Impact: Quantified Results
Districts implementing modern scheduling infrastructure report:
Time Savings
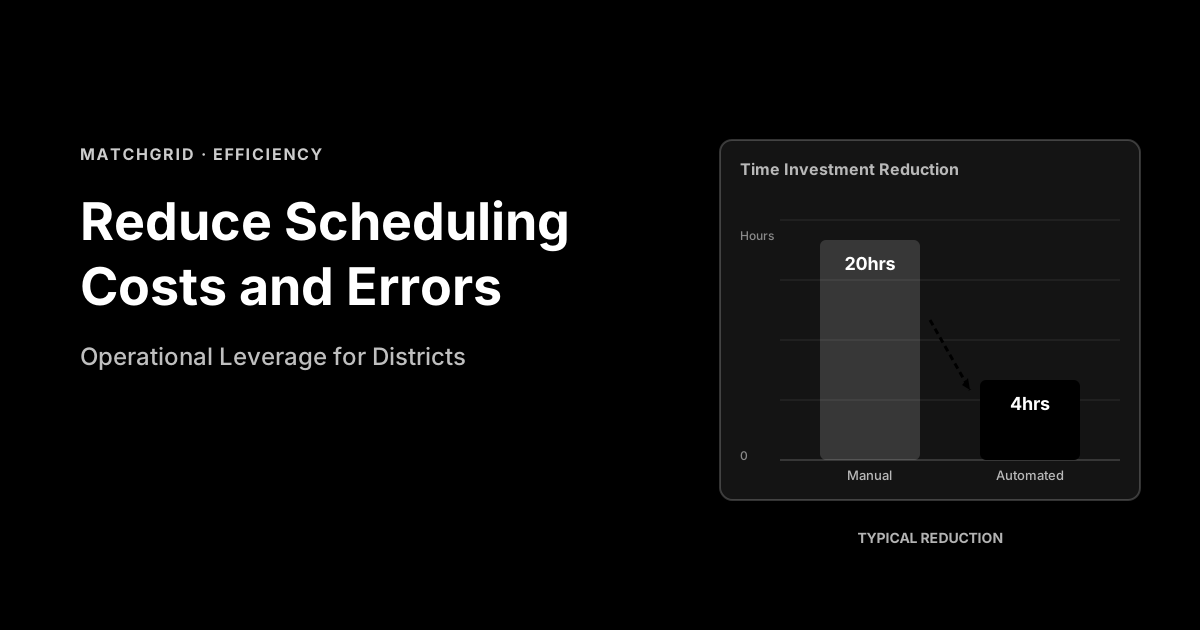
60–80% reduction in scheduling prep time – From 20 hours per school per season to 4 hours. For 8 schools: 128 hours saved per season.
75% reduction in post-publication changes – From 15 changes to 3–4 per season. Eliminates 22 hours of corrective work.
90% reduction in conflict escalations – From 40 hours of firefighting to 4 hours. Redirects 36 hours toward proactive improvement.
Cost Impact
Total time savings: 186 hours per season × $45/hour = $8,370 per season.
Across 4 sports seasons annually: $33,480 in direct labor savings.
Transportation efficiency gains: $8,000–$15,000 annually.
Total annual savings: $41,480–$48,480 for a typical 8-school district.
Return on Investment
For a scheduling platform costing $12,000 annually:
ROI: 245–304% in year one, higher in subsequent years as institutional knowledge compounds.
Payback period: 3.5 months.
Beyond Direct Cost Savings
Financial efficiency is not just about cost reduction. It’s about operational leverage.
Reallocated Capacity
Time saved on scheduling administration can be redirected to:
- Coaching development programs
- Student-athlete academic support
- Program evaluation and improvement
- Facility planning and optimization
- Community engagement initiatives
Risk Reduction
Better scheduling reduces financial exposure from:
- Event cancellations affecting gate revenue
- Transportation overtime during emergencies
- Litigation risk from perceived unfairness
- Reputational damage requiring crisis management
Asset Utilization
Improved scheduling maximizes existing investments:
- Higher facility utilization rates
- Better transportation asset efficiency
- Optimal staff allocation across programs
- Reduced need for external venue rentals
Scheduling Efficiency Is Budget Efficiency
Better scheduling delivers financial leverage across the district:
Saves staff time – Reduces administrative burden, freeing capacity for student-facing work.
Reduces emergency spending – Prevents unplanned overtime, transportation changes, and facility adjustments.
Protects transportation budgets – Optimizes routes, consolidates trips, reduces driver overtime.
Improves asset utilization – Maximizes value from existing facilities, vehicles, and staff.
Modern scheduling transforms athletics from a cost center requiring constant firefighting into an efficient operation delivering predictable outcomes.
Related guides:
- Travel Optimization Guide – Reduce transportation costs
See the cost impact for your district – Modern platforms like MatchGrid reduce scheduling costs by 60–80% while improving operational quality. Explore MatchGrid →
Frequently Asked Questions
What is the typical ROI for scheduling automation?
Districts report 245–304% ROI in year one for 8-school implementations. Payback period averages 3.5 months. ROI increases in subsequent years as institutional knowledge compounds and manual processes are fully eliminated. Larger districts see proportionally higher absolute savings due to greater complexity and more manual labor eliminated.
How do you measure scheduling efficiency gains?
Track baseline metrics before implementation: hours spent on data cleanup, number of post-publication changes, conflict resolution time, transportation cost per event. Measure same metrics after 1–2 seasons. Compare time savings (hours × fully-burdened cost) plus transportation efficiency gains. Include intangible benefits like reduced complaint volume and staff satisfaction.
What are the implementation costs beyond software licensing?
Primary costs: software licensing ($10,000–$20,000 annually for typical district), initial data migration (20–40 hours staff time), training (4–8 hours per administrator), and integration with existing systems (varies by complexity). Most districts achieve positive ROI within 6 months despite implementation costs. Ongoing costs limited to annual licensing and minimal incremental training.
Does automation reduce the need for athletic director positions?
No. Automation eliminates low-value administrative work, allowing athletic directors to focus on program development, student support, coaching quality, and strategic improvement. Role shifts from reactive firefighting to proactive leadership. Districts maintain same staffing but redirect capacity toward higher-impact work that better serves students and communities.
How does scheduling automation affect transportation budgets?
Better scheduling enables route optimization, reducing total mileage, driver overtime, and vehicle requirements. Districts typically see 5–8% reduction in athletic transportation costs through: consolidated trips for multiple teams, optimized travel sequences reducing deadhead miles, fewer emergency changes requiring overtime, and better advance planning enabling efficient route design.
What happens if the scheduling system fails mid-season?
Modern platforms use resilient cloud infrastructure with 99.9% uptime guarantees, automatic backups, and disaster recovery. In rare outages, districts retain full schedule data in exportable formats (PDF, CSV, calendar feeds). Manual scheduling can continue using exported data. Most platforms offer service level agreements (SLAs) with financial penalties for extended downtime.
Can we justify this cost when facing budget cuts?
Scheduling automation is a cost reduction investment, not discretionary spending. The ROI calculation shows net positive budget impact within months. Frame as efficiency investment that protects transportation budgets, reduces administrative overtime, and redirects staff capacity to student-facing priorities. Districts facing cuts need efficiency gains most—this delivers measurable savings that offset the investment.
Invest in Operational Efficiency
Athletic scheduling automation delivers measurable financial returns through reduced manual labor, eliminated operational rework, and improved resource utilization.
Districts that treat scheduling as an efficiency investment rather than a cost center see rapid payback and sustained operational leverage.